
Oregon Drinking Watersheds on the Web
Who’s drinking water is influenced by any given spot on the map?
That is the question Oregon Wild wants to be able to answer at a moment’s notice, and that’s the subject of my latest volunteer project.
Oregon Wild needs the data and a tool, to help understand the full extent of Oregon’s drinking watersheds and which populations are connected to any given Oregon location through common watersheds.
Data analysis and a web application
The project had two parts. Our starting point was the surface drinking watersheds Geographical Information Systems (GIS) dataset published by the Oregon Department of Environmental Quality (DEQ).
First, we followed a rigorous and tricky analysis process using multiple data sources to generate a new enhanced GIS dataset that fully maps each watershed and incorporates population data.
Second, we created a web application that could be used by anyone to easily view Oregon’s drinking watersheds and discover how populations and communities are interconnected through them.
On this post, I introduce the web application: how to access it, how to use it, and how we built it. On an upcoming post, I will describe the process that we went through to compile and assemble the underlying data.
Accessing the web application
To access the web application, head over to https://watersheds.oregonhowl.org. The site is also embedded in the HOWL site as a new ‘spotlight’.
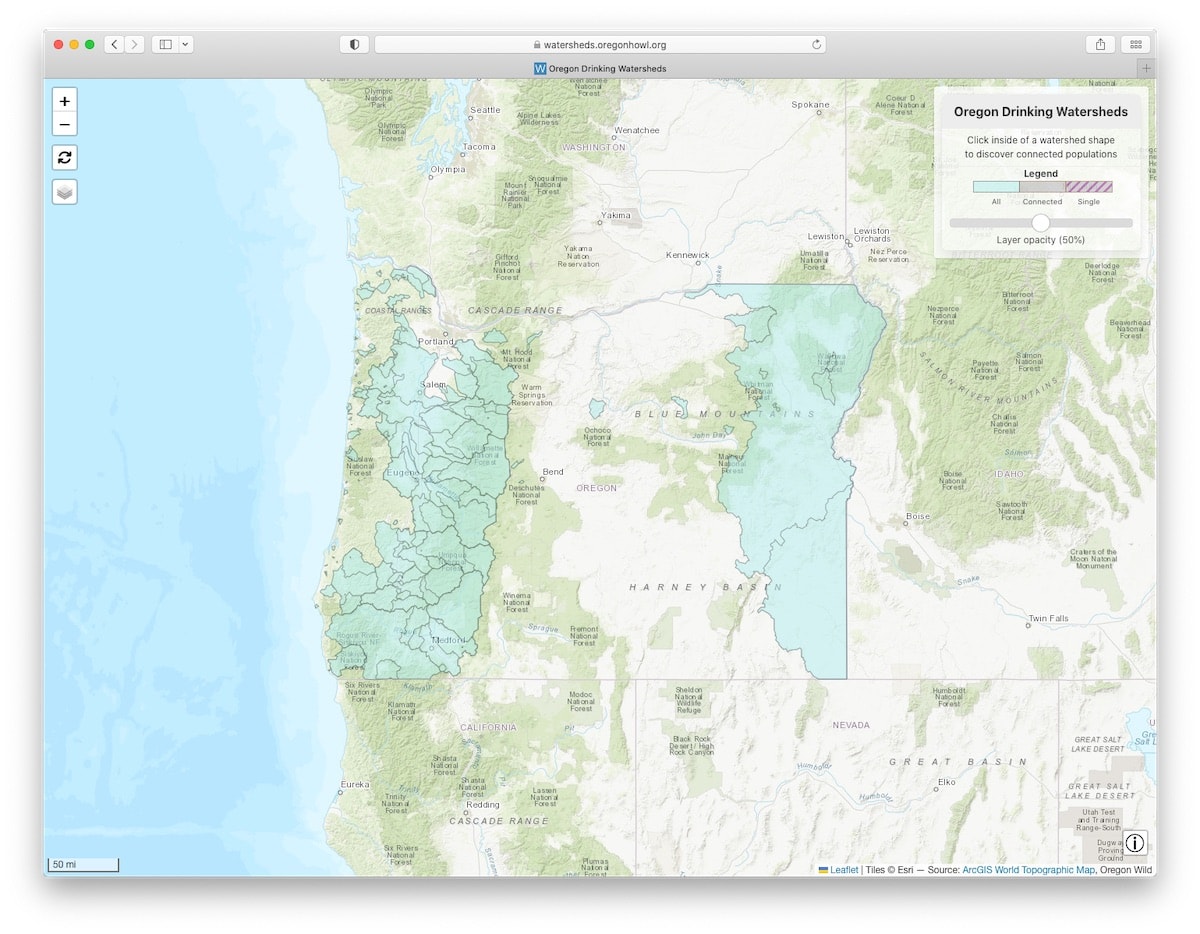
You will see a web map centered in Oregon, with a turquoise polygon layer, representing the geographical extent of Oregon’s drinking watersheds.
-
Top-left - Controls for zooming, view reset, base maps and overlays.
-
Top-right, An information panel that displays data as you interact with the map. You can adjust the opacity of the watersheds layer by moving the slider left or right.
-
Bottom-right, An “About” control used to display general information about the project.
Viewing watersheds
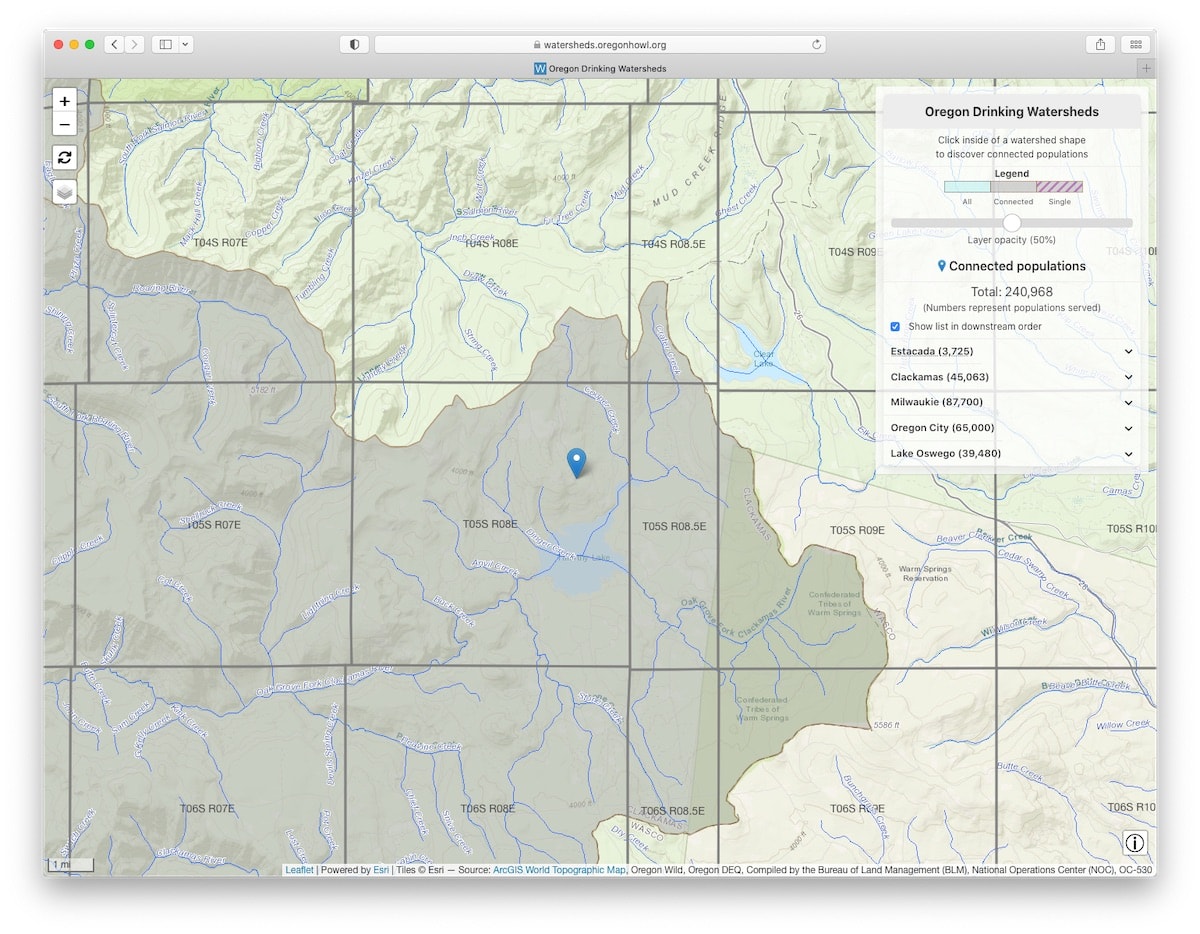
Click on a spot within any of the turquoise polygons. In the example below we show that the picked spot near Timothy Lake, connects 240,968 people through the water flow in the Clackamas River watershed. The watershed path is highlighted in gray on the map.
Logging, road building, or other disturbance near that particular spot could negatively affect the drinking water quality of Estacada, Clackamas, Milwaukie, Oregon City and Lake Oswego!
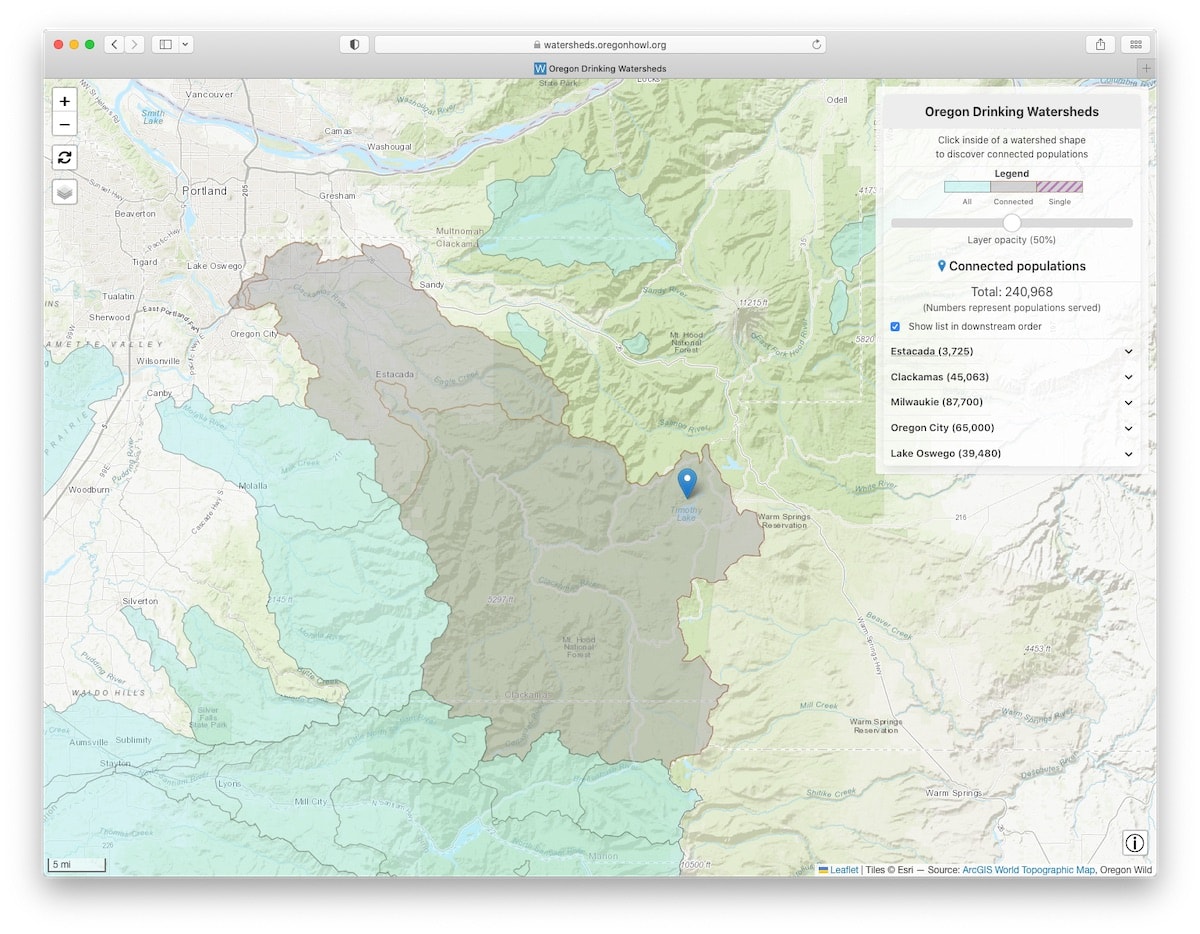
By default, the list of communities shown in the information box is sorted in descending population order. But it can also be shown in “downstream” order by clicking on the checkbox. By the way, the application will remember your selection the next time you come back (if you are using the same browser).
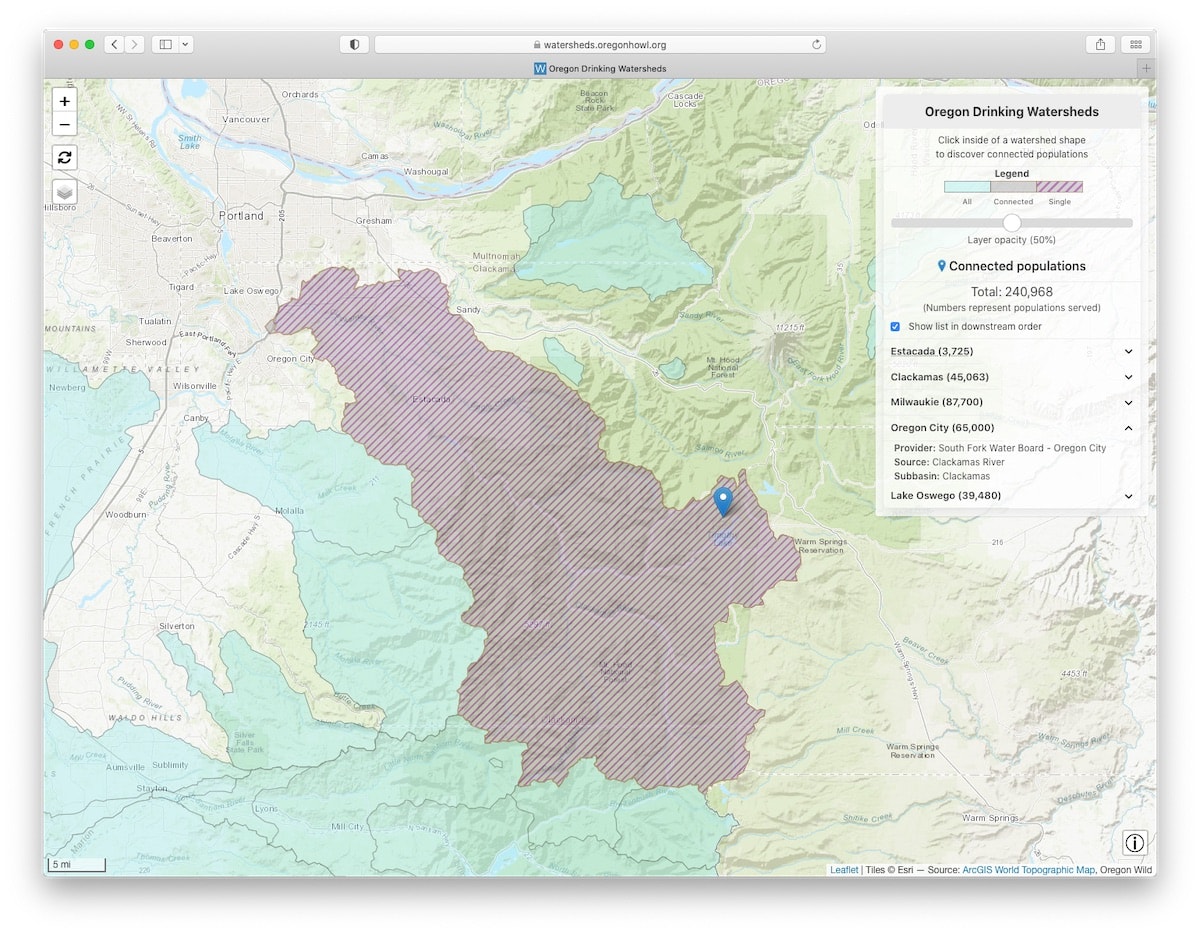
Clicking on the community name or the associated down arrow, displays more details about the water system for that community: Provider, Source, and Subbasin. At the same time, the application highlights the entire watershed for that community using a purple stripe pattern. In the example below, we are looking at Oregon City.
Available base map and overlay layers
We have included a number of layers to help customize the view.
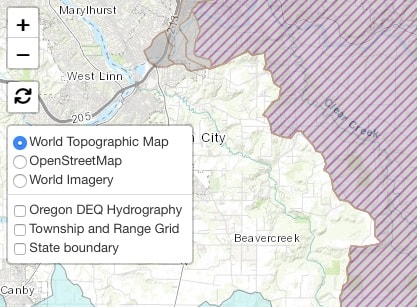
Select among three base maps: World Topographic Map (default), OpenStreetMap, or World Imagery. Pick one or more overlay layers: Oregon DEQ Hydrography, Township and Range Grid, and State Boundary.
Here is an example showing the Township and Range Grid and the Oregon DEQ Hydrography overlay layers:
Embedding in a web site
The web application can be easily embedded in any web site by using the html iframe tag. Simply insert an iframe tag in your post or page with a link to site, like shown in the example below.
Notice how it is not merely an image, but the active Oregon Drinking Watersheds site which you can fully interact with.
The code used to display the site above is:
<iframe width=“100%” height=“600” src="https://watersheds.oregonhowl.org/" frameborder=“0”></iframe>
Application building blocks
The Open Source application takes advantage of the following building blocks:
Mapping with Leaflet
For this application, I decided to use Leaflet. In my experience, Leaflet is the Open Source mapping library that delivers the quickest development time.
I have used MapLibre in the past because of its excellent performance, especially when accessing vector tiles, and I mulled over whether to use it for this project or not. I also considered OpenLayers, which offers a vast array of geo-processing capabilities. In the end, for this relatively simple application, nothing beats Leaflet’s ease of use and healthy plug-in ecosystem.
I augmented Leaflet’s capabilities with the following plug-ins:
-
ESRI Leaflet - The Government-hosted “Oregon DEQ Hydrography” and “BLM Township and Range Grid” overlay layers are based on ESRI’s ArcGIS mapping services. This plug-in simplifies access to these layers.
-
Leaflet PIP - This plug-in developed by Mapbox, provides a convenient way of finding overlapping polygons under a given set of coordinates, which is exactly what I needed to do to expose connected watersheds.
CSS with Bulma
Dealing with CSS can be a real pain. So many options and quirks! That’s why I went with Bulma, an easy to use and customizable CSS framework that can be tweaked to load only the pieces that are actually being used. I have used Bulma in other projects and I enjoy its simplicity and flexibility.
HTML templating with Handlebars
I really like to keep all HTML out of the Javascript application code. Handlebars allows me to use templates to easily render HTML while keeping presentation and logic nicely separated.
On this post I described the latest web application I developed for Oregon Wild as a volunteer. I described its usage and capabilities, as well as the building blocks I used to create the site.
I will talk about the underlying data on an upcoming post.
Please contact me if you have any feedback or if you see any errors that need to be corrected.
Thank you!
Many thanks to Erik Fernandez of Oregon Wild for giving me the opportunity to work on this project.