
Oregon Drinking Watersheds - compiling the data
In my previous post, I introduced the Oregon Drinking Watersheds project and I described the web application in detail. In this post, I will discuss the process we used to compile the data.
We carried out this process under the direction of, and in partnership with Erik Fernandez of Oregon Wild.
The data for this project come from multiple sources
Drinking watershed data
The primary data source for the watersheds project is the Surface water drinking water source areas in Oregon dataset, published by the Oregon Department of Environmental Quality (DEQ). This dataset delineates all community public water systems using surface water directly, or groundwater under the influence of surface water.
Each water system watershed is mapped upstream from its intake. When there are multiple water intakes for a single watershed, each water system is mapped upstream from intake to intake, resulting in a series of non-overlapping areas representing sections of a hydrological unit.
For example, the image below shows how DEQ maps the data for the Clackamas River watershed.
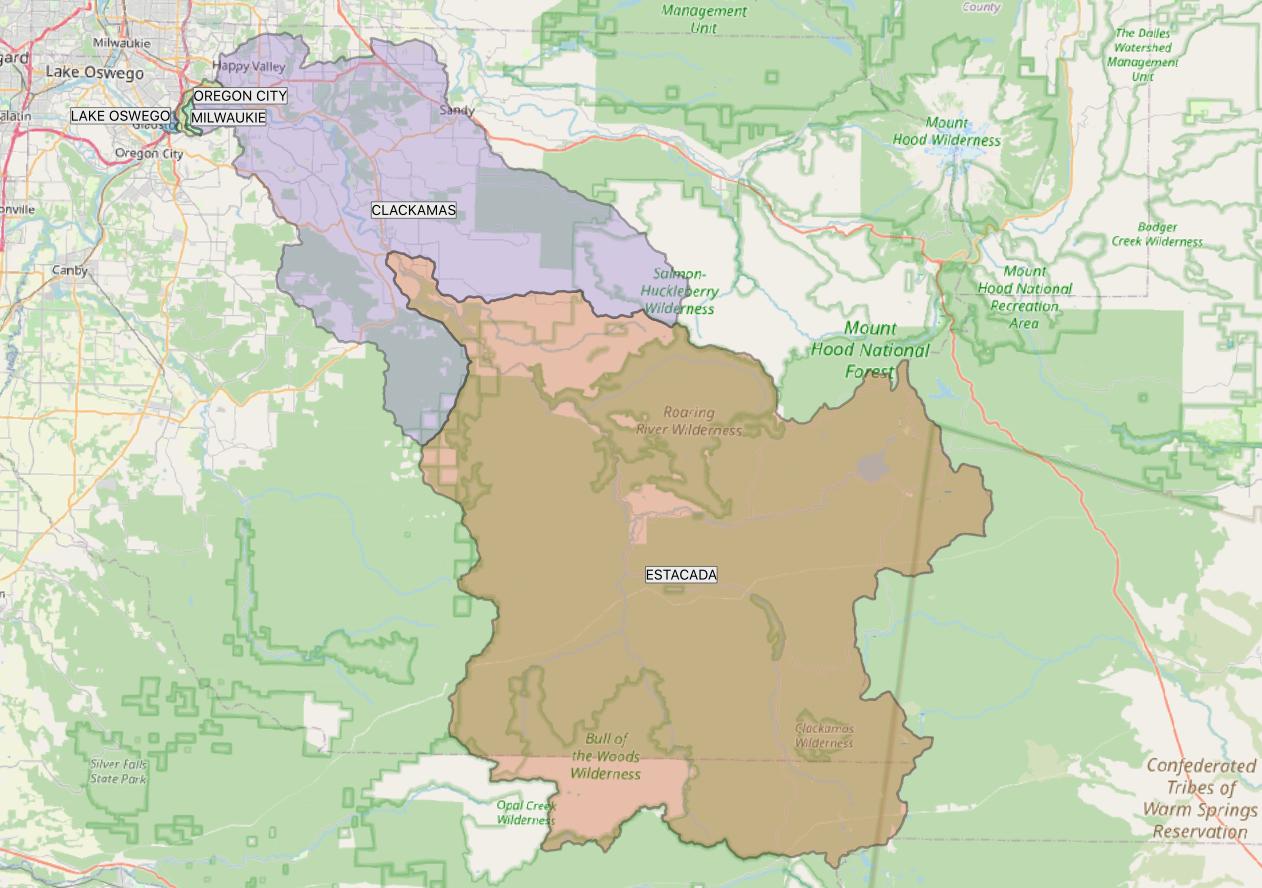
Oregon DEQ, OpenStreetMap
There are five non-overlapping sections of the Clackamas watershed. Moving upstream from intake to intake, they are: Lake Oswego, Oregon City, Milwaukie, Clackamas, and Estacada.
Population data
The DEQ data source does not include population information.
To obtain population data, we consulted primarily Oregon Health Authority’s (OHA) Drinking Water Online database. One of the data items available is the population being served by a given water system. For example, for the city of Estacada, the site shows a population of 3,725.
Another source of population data came from Portland State University’s (PSU) Population Estimate Reports, which is the official source of population estimates for the state of Oregon. For example, for the city of Lake Oswego, PSU reports a population of 39,480 for the year 2020.
Finally, for population numbers difficult to come by, we resorted to individual water provider and city websites.
Hydrography data
We used the Oregon Rivers (Rivers Reach) dataset and the Oregon Watershed Boundary Dataset, both available at the Oregon Spatial Data Library, to assist in understanding water flows and watershed boundaries when analyzing areas with complicated topographies (e.g., Umpqua River), and areas where upstream watersheds were missing from the DEQ dataset (e.g., Rogue River, Chetco River).
We followed a structured methodology
Objective
The objective was to create a dataset in a Geographical Information System (GIS) Shapefile format with the full extent of each drinking watershed and the population it serves. This is in contrast to the DEQ dataset which only maps watersheds from intake to intake, and not the full extent of the watershed. Also, the DEQ dataset does not include population data.
An additional requirement was to include the total downstream population for each watershed record (i.e, total population from a given watershed and below).
Note that all water systems located in shared watersheds are represented as overlapping polygons. Given an arbitrary geographical location, we can easily produce a list of all polygons (and associated communities) that intersect that location (multiple items, or just one when there are no overlaps). This exposes all the water systems related or connected to the location. Moreover, by sorting the list in descending order of total population, the list can be presented in downstream order!
Tools
To perform this analysis, we used the QGIS GIS, an open source application for geospatial analysis and mapmaking. It is an extremely powerful GIS package and it is free!
We also used the Mapshaper Command Line Interface (CLI) to generate the GeoJSON dataset used by the web application. Mapshaper is also open source and free.
The Oregon Wild team utilized Esri’s ArcMap GIS as well, for geospatial analysis and data manipulation.
Process
Add population
We consulted the population data sources and updated the DEQ watersheds with the corresponding figures.
There are cases in which two or more watersheds are used to supply water to a single community.
-
If the watersheds are independent, and belong to the same hydrological unit, we merged the watersheds into a single shape/record (e.g., City of Warrenton).
-
If the watersheds fall under separate and independent hydrological units, we split the population evenly across watersheds (e.g., City of Powers). In some cases we had to do both (e.g., City of Corvallis).
Extend watersheds
To delineate the full extent of each watershed, we performed the following steps:
-
Identified set of DEQ water systems that share a watershed (e.g., Clackamas); we used the hydrography data to assist in this step
-
Starting from the uppermost polygon in the set,
- Made a copy of the polygon
- Merged the copy with the next downstream polygon, taking the attributes of the latter
- Repeated going downstream one-by-one until reaching the last polygon in the set
The method is the same, but it becomes a bit tricky, when we find watersheds that have multiple “branches” (e.g., Umpqua River). We used the hydrography data to visualize the direction of the water flow, in order to help decide which polygons should be merged. This method also works for tributary watersheds located inside larger units (e.g, city of Ashland and Rogue River watershed).
The example below shows the watershed for the city of Clackamas. On the left is the DEQ shape. On the right is the extended watershed, after performing the steps above for one iteration.
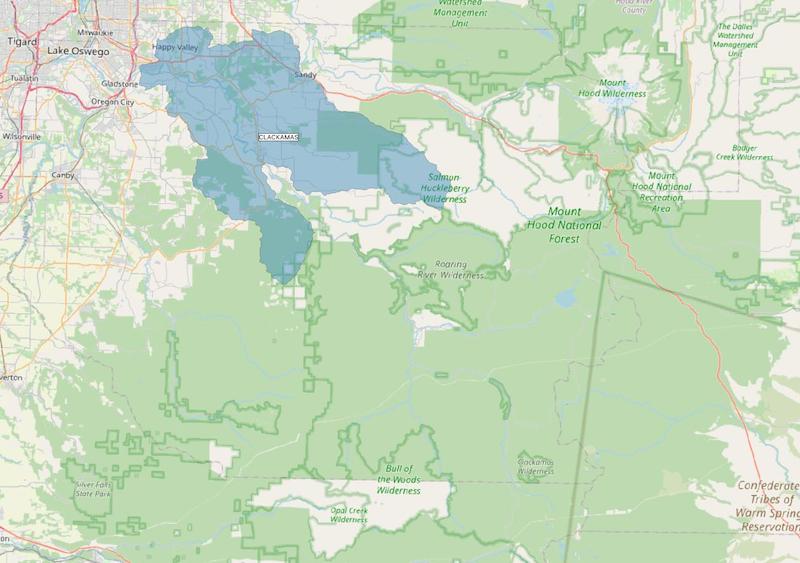 City of Clackamas - Before
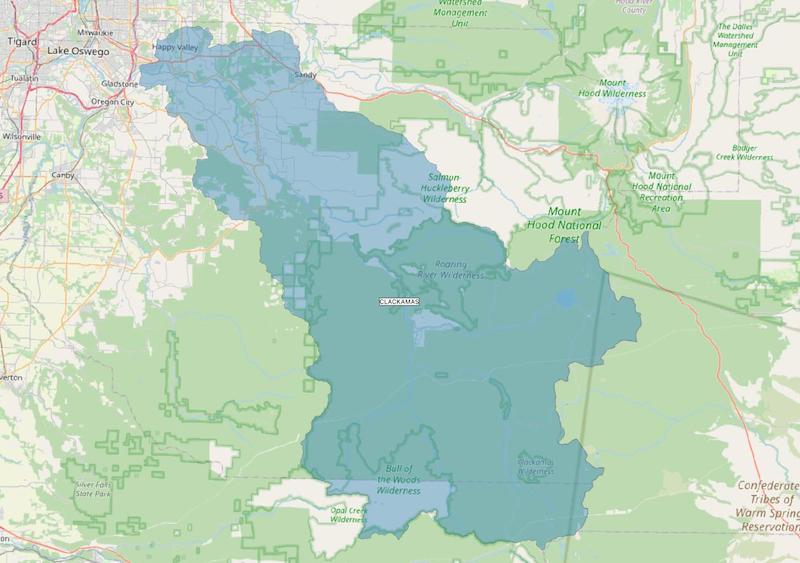 City of Clackamas - After
Add missing watersheds
In some instances, there were entire upstream watershed sections missing from the DEQ dataset. Take, for instance, the city of Gold Beach. In the DEQ dataset, the watershed is limited to the Lower Rogue and the Lobster Creek 5th field watersheds. So we added the missing parts, which include the entire upstream Rogue River and Illinois River watersheds. Often in these cases the intake is a well that is influenced by surface water.
We extended the watersheds for the cities of Clatskanie, Rainier, and Herminston to include the Columbia River watershed. We also extended the watershed for the city of Ontario to include the Snake River upstream from Ontario, plus the Jordan and the Owyhee Rivers. In addition, we extended the watershed for the city of Monmouth to include missing parts up the Willamette River and tributaries.
We added the watersheds for the cities of Brookings and Harbor, from the intakes up the Chetco River (see image below). Oregon Wild determined that these water sources should have been considered “surface water,” but they were missing from the DEQ dataset.
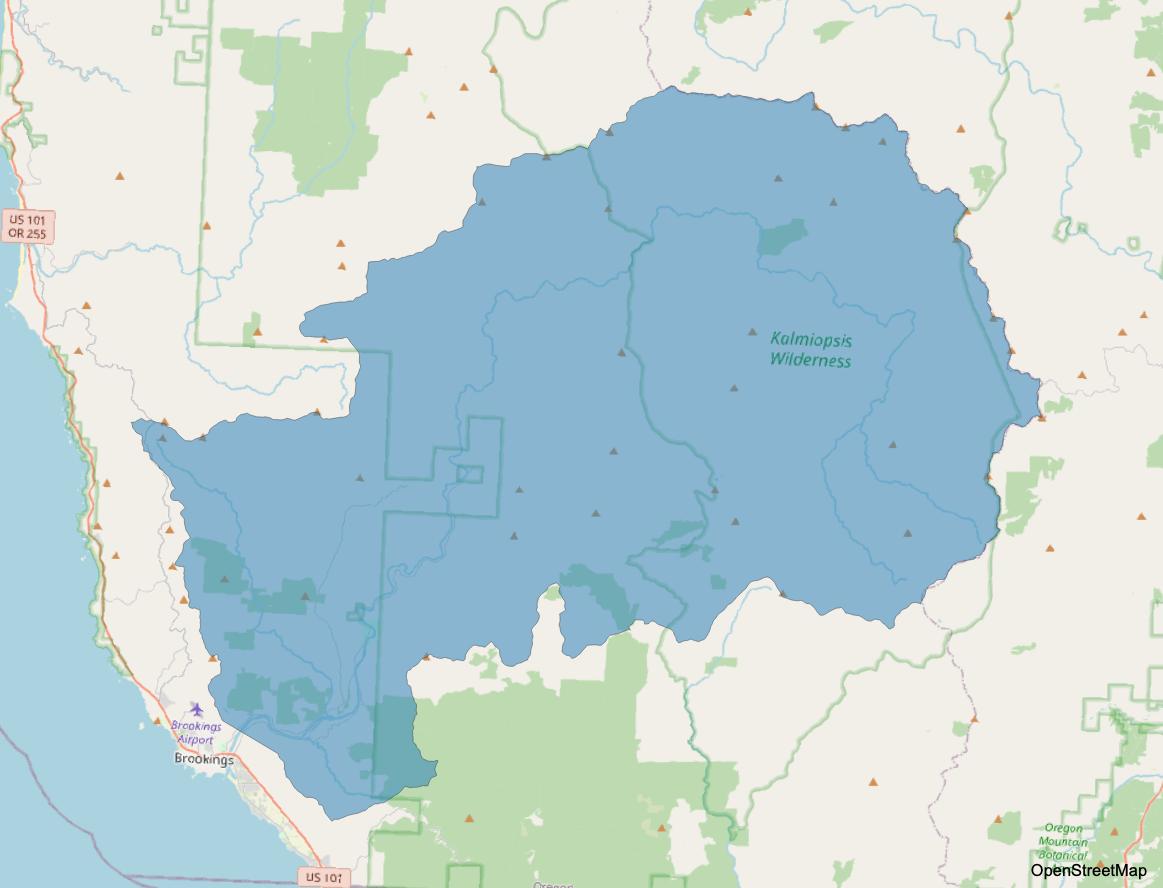
Brookings and Harbor watershed
Remove some watersheds
We removed inactive and zero population watersheds. We also removed the watershed for the city of St. Helens, as the source is an underground aquifer, so it was deemed to be a groundwater source as opposed to a surface water source.
Snap geometries
We ran a geometry snapping algorithm to make sure all overlapping and adjacent polygons lined up exactly against each other, thus eliminating undesirable visual artifacts when viewing the dataset. We used a tolerance of 200 feet.
Compute total population per watershed
After all watersheds were extended following the process described above, we ran an algorithm to compute the total populations associated with every watershed. The total population is defined as the sum of the populations associated with a given watershed plus all the downstream ones.
Given the way we have constructed our dataset, in any set of intersecting polygons, the ones downstream are always larger in area than the ones upstream. So, to calculate the total population of a watershed, we just have to add to its population, the population of every larger (or equal) intersecting watershed.
Moreover, in our dataset, since every intersecting polygon is fully contained inside of every one of the larger ones it intersects, just picking an arbitrary point inside of a polygon is sufficient to find intersecting polygons.
Finally, rather than intersecting every polygon against every other one in the dataset (about 190 by 190), we can narrow down the number of intersection operations needed by first looking for candidate polygons, i.e., polygons that contain a common point inside their bounding boxes. This a much faster operation than polygon intersections, thanks to QGIS' spatial index feature. With this trick, we reduce the number of actual intersection operations from about 36,000 to just about 560!
The algorithm’s pseudocode is laid out below.
for each polygon P
  total population of P = population of P
  find a point A inside of P
  for each candidate polygon C where its bounding box contains A
    if C != P AND C intersects P AND area of P <= area of C
      total population of P += population of C
    end if
  end for
end for
We implemented the algorithm using QGIS' Python console capability. It takes just about 10 seconds to run. You can inspect the code here.
Generate simplified dataset for the web application
We generated a separate GeoJSON dataset using the WGS84 coordinate reference system (CRS) to be used in the web application (the source CRS is EPSG:2992 - NAD83 / Oregon GIC Lambert (ft)).
To reduce the size of the dataset, we ran a simplification algorithm and limited the precision of the latitude and longitude coordinates to four decimals.
It should be noted that, for the web dataset, we decided to drop the Columbia watershed extensions to the cities of Clatskanie and Rainier, since the populations involved are relatively small, and the large polygons tended to clutter the web view by their sheer size.
There were some challenges to overcome
This project was quite complex with numerous difficult decisions on how best to represent the most accurate data and mapping available.
Complicating factors for some cities and watersheds include cities that get their drinking water from multiple watersheds, and cities that get their drinking water from different sources based on time of year. We also suspect that there are many small watersheds that may only serve small populations which are not mapped by DEQ, and thus are not included in this analysis. We added those that we were aware of, but likely not all.
We attempted to stay true to answering the question, “for any given spot on the landscape, how many people depend on this spot for their drinking water?”
We know that there is room for improvement. If you see any errors in the data, please contact us and we’ll take a look.
The results of this project are available on Github, and since all the data have been derived from U.S. and Oregon Government sources, they have been placed in the Public Domain.